
In this article, we delve into the economic odyssey of the United States from the mid-20th century to the present day. It’s a fascinating journey, punctuated by periods of rapid expansion, times of stasis, and even moments of regression. As we trace the contours of this economic landscape, we uncover the stories behind the numbers and explore the interplay of technological innovation, policy decisions, demographic shifts, and global events that shaped America’s economic trajectory. The evolution of U.S. Gross Domestic Product (GDP) is not just a tale of numbers but a reflection of the nation’s character, resilience, and ambition. In this article, we invite you to join us in understanding the intricacies and insights hidden within the labyrinth of economic growth.
Major Trends and Insights
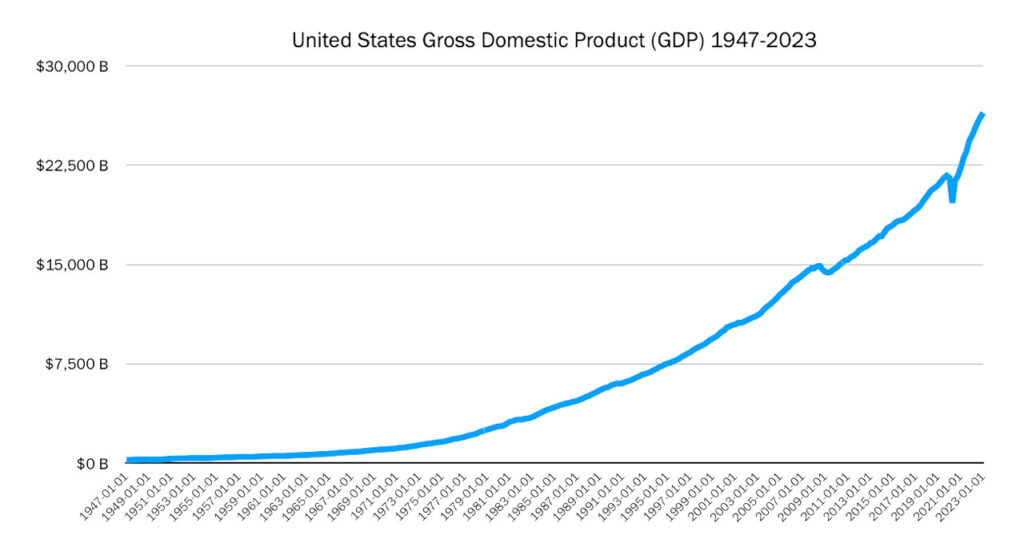
- Long-term growth: One of the most obvious trends is the overall long-term growth of the United States’ GDP. The GDP in 1947 was $243.164 billion, and it steadily increased to $22,675.043 billion by 2023. Despite short-term fluctuations, the overall trajectory is upward, indicating the expansion and growth of the U.S. economy over this period.
- Business Cycles: The data clearly reflects the cyclical nature of the economy. We see periods of expansion followed by contractions. For instance, the GDP growth slows down or even declines during recessions, such as the ones in the early 1980s, early 1990s, early 2000s, and during the Great Recession in 2008.
- Recessions and Recoveries: The data allows us to observe the impact of significant economic events. For example, we can see the effect of the 2008 financial crisis when the GDP dropped from $14,898.999 billion in 2008-Q3 to $14,608.208 billion in 2008-Q4. Similarly, we can see the economy’s recovery and expansion in the years following the crisis.
- Acceleration in the late 20th Century: The GDP growth appears to have accelerated considerably from the 1980s through the early 2000s, reflecting significant economic expansion during this period. This could be due to various factors such as advancements in technology, globalization, and other economic policies.
- Recent Slowdown: The data suggests a slowdown in GDP growth post-2010, which might be an area for further investigation. This could be due to a variety of factors, including the after-effects of the 2008 financial crisis, changes in demographics, or structural changes in the economy.
- Effects of Major Policies or Events: There might be correlations between GDP growth and major government policies or global events. For example, periods of rapid growth might be associated with certain fiscal or monetary policies, while downturns could be linked to oil price shocks, wars, or other significant events.
- Seasonality: There also appears to be a degree of seasonality in the data, with certain quarters often exhibiting similar trends year over year. This could be due to various seasonal factors such as holiday spending, tax schedules, or agricultural cycles.
The Forces Behind the Acceleration in the 1980’s and 1990’s
There are several events and developments from the late 20th century that likely contributed to the acceleration in the growth of GDP:
- Technological Innovation and the Dot-Com Boom: The 1990s, in particular, were a time of significant technological innovation. The advent of the internet and rapid advancements in computer technology transformed the business landscape, leading to new industries and improving productivity across many sectors. This period also saw the “dot-com” boom, a speculative bubble focused on internet-based companies, which, despite its eventual bust, contributed significantly to economic growth during this period.
- Globalization: The late 20th century saw an acceleration in globalization, as trade barriers were reduced and countries became more economically interconnected. This created new markets for U.S. goods and services, boosting exports and GDP.
- Financial Deregulation: In the 1980s and 1990s, there was significant deregulation of financial institutions and markets, aimed at increasing competition and efficiency. While the long-term effects of these changes are complex and still debated today, they likely stimulated economic activity and growth in the short term.
- Demographic Factors: The post-World War II baby boom generation was reaching peak working age and productivity during this period, contributing to growth in GDP.
- Increased Consumer Spending: Economic growth in this period was driven in part by increased consumer spending, which was facilitated by the expansion of credit and rising asset prices, including a strong housing market.
- Productivity Improvements: There were significant gains in productivity during the late 20th century, driven by both technological innovation and changes in business practices.
- Government Policy: Fiscal and monetary policies during this period were generally conducive to economic growth. There were major tax reforms, including cuts that increased disposable income and business investment.
- Fall of the Soviet Union: The end of the Cold War opened up new markets and created a “peace dividend” that allowed for a redirection of public resources from defense to other areas.
It’s important to note that these are broad factors that likely contributed to GDP growth during this period, and the actual economic impact of each would require more detailed analysis. It’s also worth mentioning that some of these factors, such as financial deregulation and the dot-com boom, also set the stage for future economic challenges.
Understanding Seasonality
In analyzing the seasonality of US GDP data, it’s crucial to differentiate between seasonally adjusted and unadjusted data. Seasonally adjusted data are calculated using seasonal factors which account for regular, predictable changes that happen at the same time each year such as climate conditions, production cycles, model changeovers, holidays, and sales. These factors allow data users to focus on changes that are not typical for the time of year. The unadjusted data, on the other hand, reflect the actual prices paid by consumers and are used extensively for escalation purposes1.
The Bureau of Labor Statistics uses an Intervention Analysis Seasonal Adjustment (IASA) for some data series to estimate and remove distortions caused by unusual events, enabling a more accurate representation of the seasonal pattern2. For instance, in 2023, 57 series were adjusted using IASA, including selected food and beverage items, motor fuels, and vehicles3.
It’s important to note that seasonally adjusted data, including the U.S. city average All items index levels, are subject to revision for up to five years after their original release. Each year, new seasonal factors are calculated and applied to the last five years of data. Seasonally adjusted indexes beyond the last five years of data are considered to be final and not subject to revision4.
Lastly, the seasonal status of every series is reevaluated annually based on certain statistical criteria. For 2023, 44 of the 81 components of the U.S. city average all items index were seasonally adjusted5.
In summary, the impact of seasonality on the US GDP data is a complex process that involves the careful adjustment and reassessment of various components in the data series to accurately depict the underlying economic trends.